BIOL 210 Problem Set 10
Week 11, Nov 11-15
ps10.RmdGeneral Instructions for Problem Sets
The goal of the problem sets is to give you practice thinking about and working with the concepts that we are covering. You may work with others to complete these assignments but should submit your own responses (not copied from someone else’s response).
Before completing a problem set, you should review the content videos for the week and it may be helpful to complete those before the related class periods as well.
Once you have answered the questions and before you turn in your responses, check your work against the answer key (linked for each problem set). If your responses are missing important information or incorrect, you need to correct them, using a different color font and explaining why your original answer was insufficient.
Use the link at the top of this page to turn in your completed assignment, including corrections.
Related Readings
About Speciation
About Population Ecology
-
How Populations Grow: The Exponential and Logistic Equations (Intermediate)
Note: There are some formatting errors in the first sentence of the paragraph just after Figure 2. Here’s what it should say (corrections in bold): “Any value of R can be represented in an infinite number of ways (e.g., if R = 16, we could write R = 8 x 2, or R = 42, or R = 32/2, or R = 2.718282.77).”
About Life History
From Biology 2e: Chapter 45. Population and Community Ecology
Scitable: Population Limiting Factors
Scitable: Introduction to Population Demographics
Scitable: Survivorship Curves
Scitable: Environmental Constraints to the Geographic Expansion of Plant and Animal Species
Scitable: Causes and Consequences of Dispersal in Plants and Animals
Scitable: Disease Ecology
Scitable: Population Ecology at Work: Managing Game Populations
Questions
The content video described different ways to think about how to define a species. With the next four questions, let’s think about why there are so many different species definitions and what the consequences are of choosing one versus another.
- What’s the common idea that underlies the different methods of defining species? That is, what we might think of as a basic way to explain what we mean when we say that two organisms belong to different species?
- Why is it so hard to define a single species concept that works in all cases? Why might it matter what species concept we choose to apply?
- The process by which new species evolve, speciation, is commonly divided into two general types: allopatric speciation and sympatric speciation.
- What’s the difference between sympatric and allopatric speciation? Why do biologists think this matters?
- What evolutionary forces are most important in each type of speciation (sympatric and allopatric)?
- What makes sympatric speciation controversial?
- With some frequency we find what appear to be well-defined species (they look or behave very differently) that are capable of and in fact experience some level of gene flow. Give a hypothesis for why some pairs of closely-related species can produce hybrids while others cannot.
For the next three questions, we’ll focus on a couple of graphs demonstrating logistic growth. The content videos discuss the idea that logistic growth occurs when a population can’t keep growing at the maximum possible rate forever because of factors like limited resources or increasing numbers of predators. Because the rate of growth slows down as the population size increases, logistic growth is a form of density-dependent growth. By describing the growth as density-dependent, we can test for limitations on growth without having to observe population size over long periods of time. Instead, we can measure growth-related traits for a species in populations that have differing densities. To think about what this means—and what a density dependent pattern looks like, use the figures below to answer the following questions.
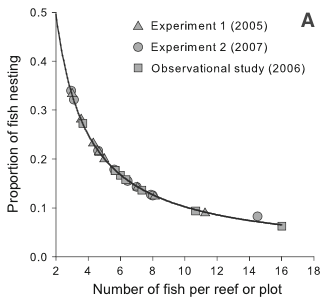
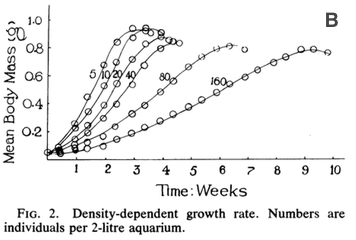
Figure 1. Measurements of density dependence in (A) populations of bridled gobies (a fish) and (B) Rana tigrina tadpoles.
- Figure 1A shows data collected from natural populations of the bridled goby, a coral reef fish that exhibits density-dependence.
- Describe the relationship depicted in this graph (specify the axes and how one variable changes with the other). Exactly what is it that tells us density-dependence is occurring?
- What do you think the graph would look like if there was not density-dependence?
- What is the relationship depicted here? How can we tell that there is density-dependence?
- What would the graph look like if growth was not density-dependent?
- What was confusing or interesting to you about this week’s material?
- Did you have any key insights while studying this material?
- Does anything from this week’s material particularly stick with you?
When you are finished, check your responses on the key for PS10.
Remember to sign the Honor Code on your assignment.